/ YI-WEN LIN
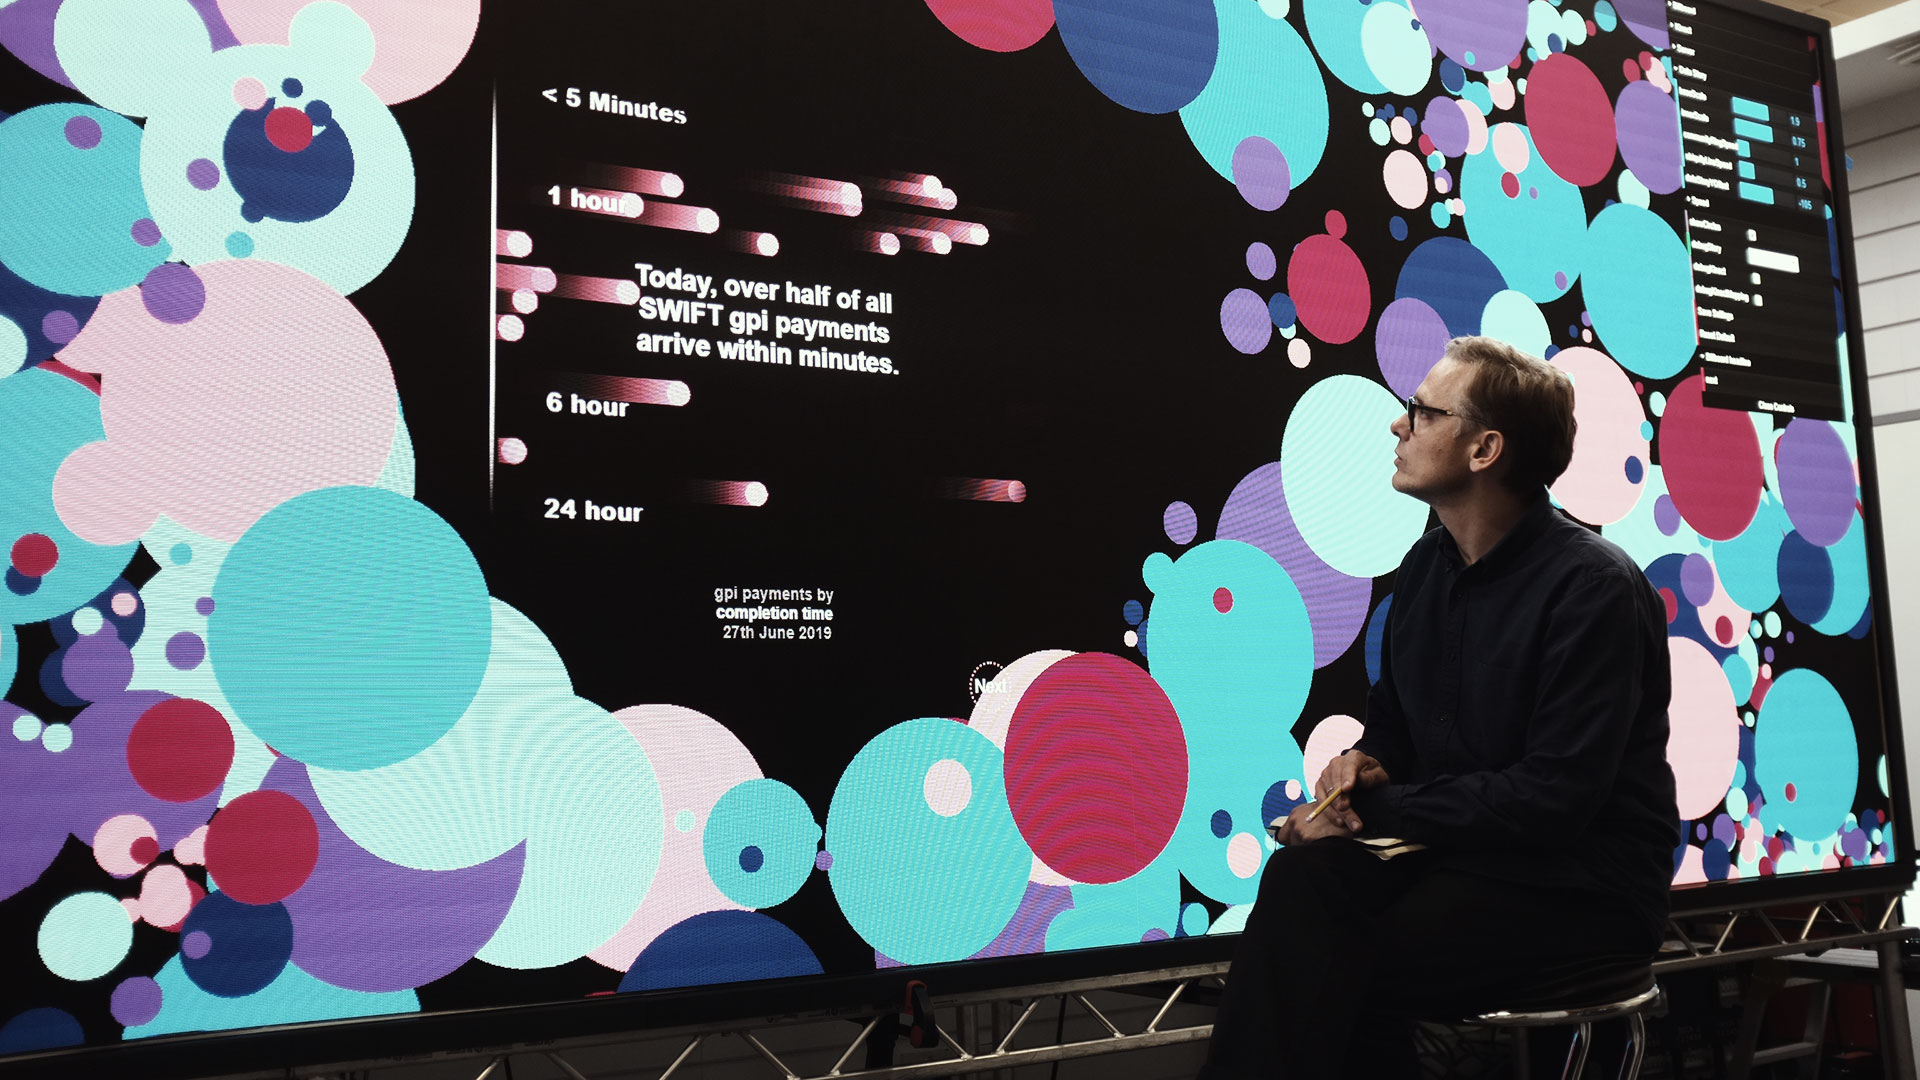
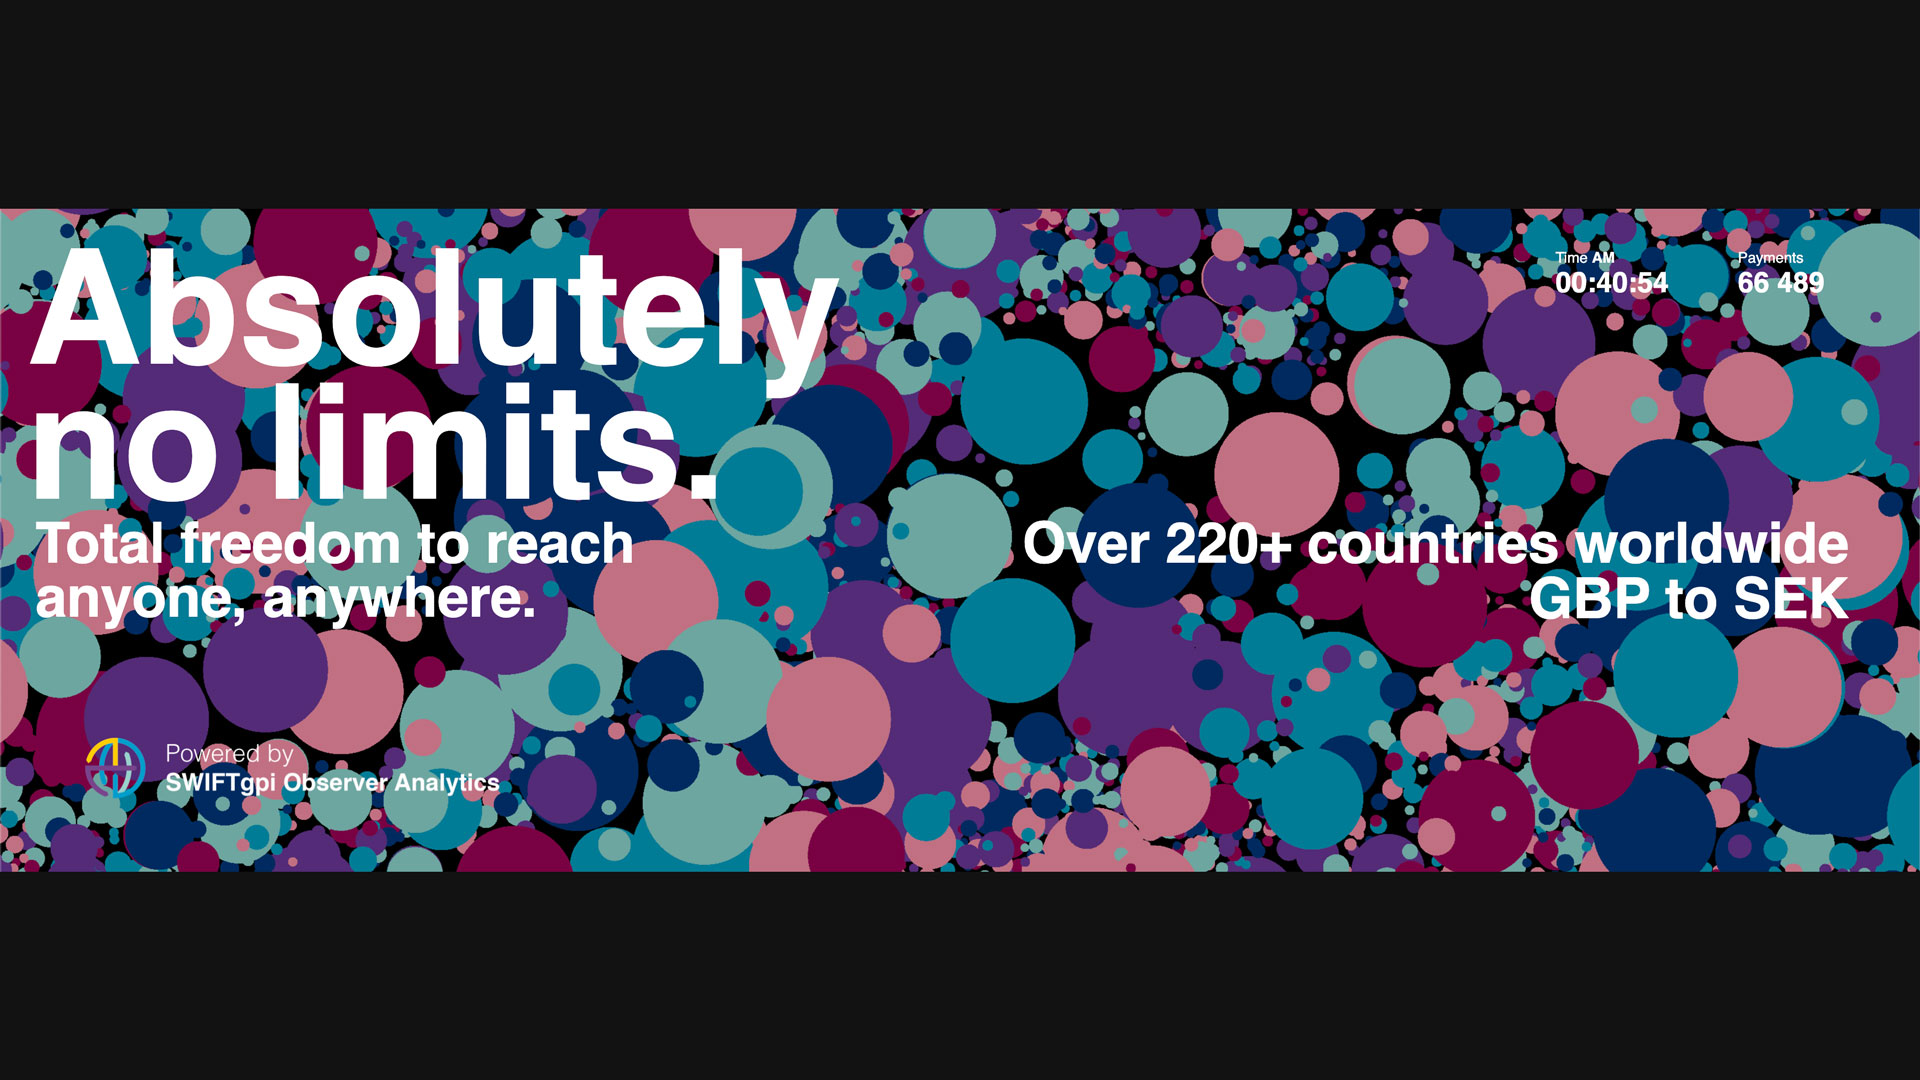
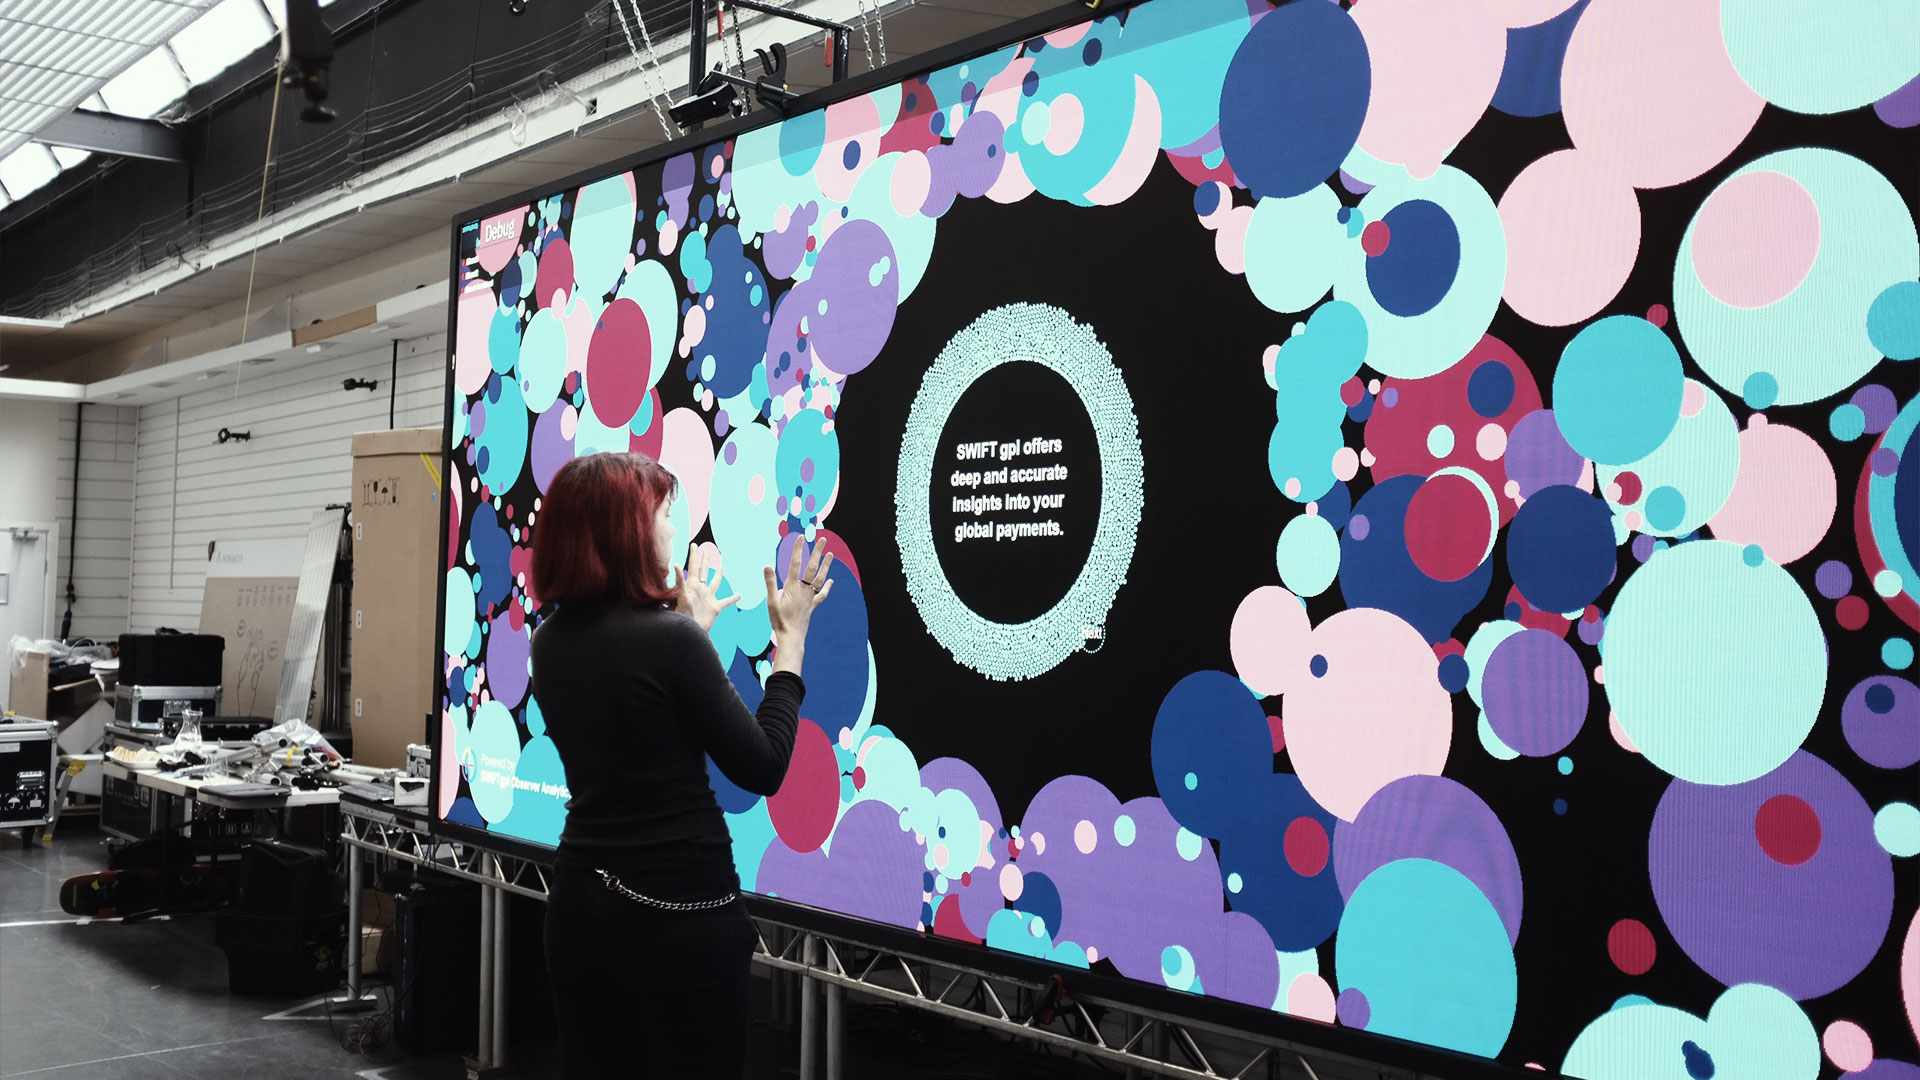
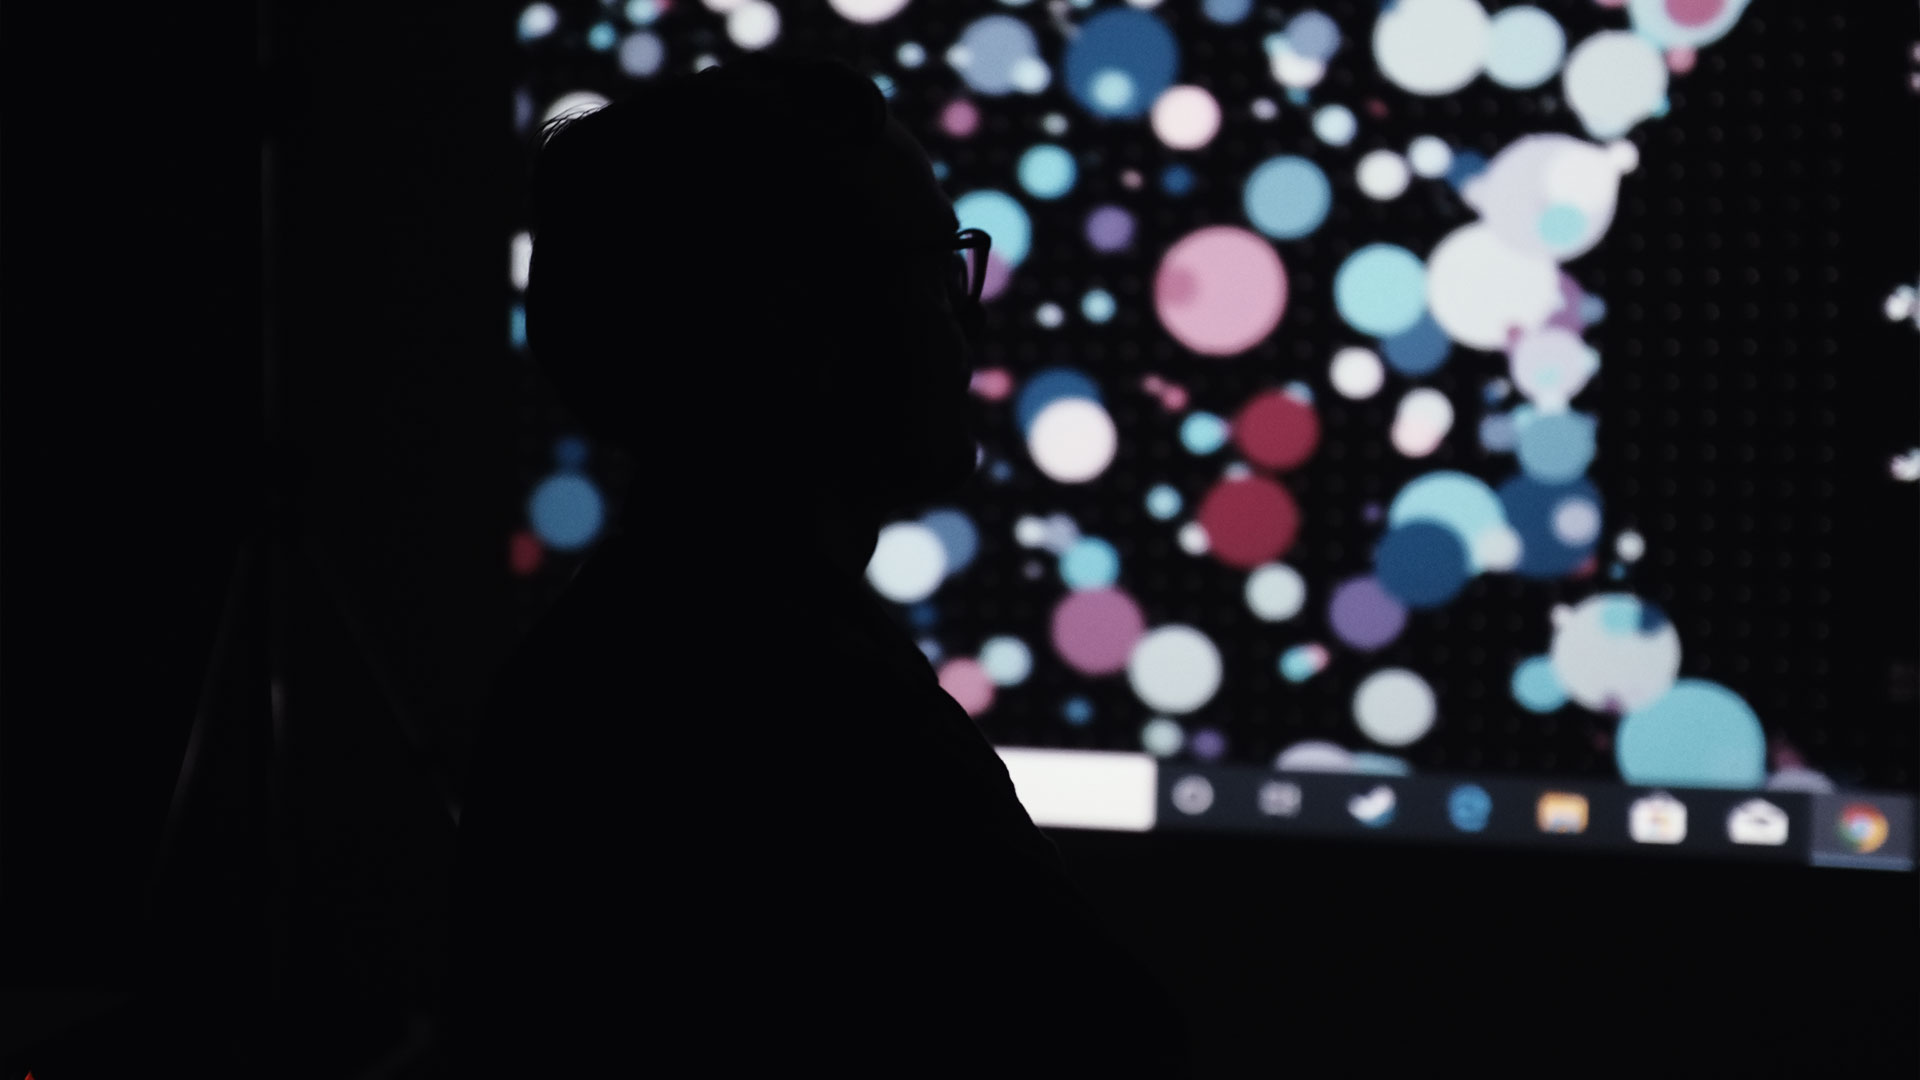
An interactive data visualization project, using the data of the transactions of the Sibos in one day. Each circle represents a transaction, the bigger the circle is, the larger the amount is. There are also 5 interactive data stories that are randomly displayed when viewers get close to the LED wall. There are different layers of interaction in this project. The first layer is for viewers that's more than a meter away from the LED wall. 2 Kinects are set up to capture the viewer's motion and use it to affect the flow of the circles. The second layer is when the viewer stands next to the LED wall, a randomly selected data story will appear in front of the viewer. The last layer is the touch LED wall that the viewer can go through the different pages of the data story or even to the next data story. The visualization is built using WebGL and a custom library. Processing for capturing motion with kinect, and lastly a node server is set up as the central control transmitting message and events between WebGL and the kinect using websockets and OSC.
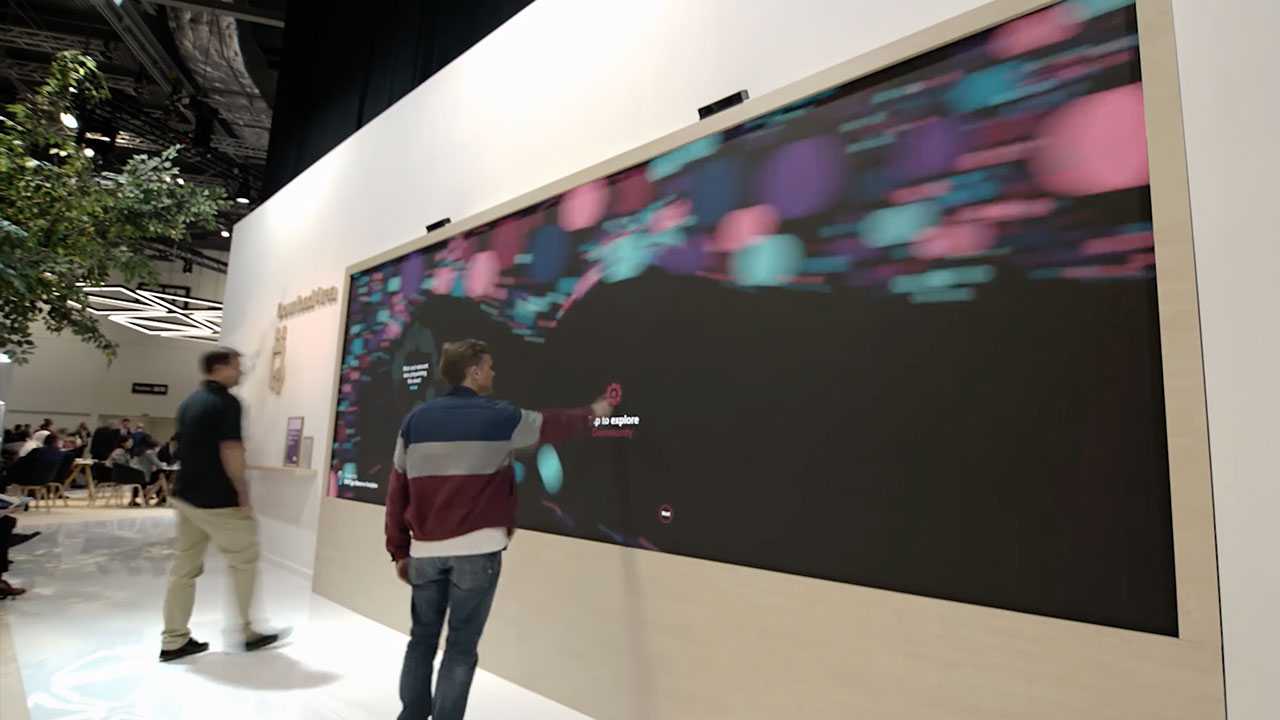
Next
Project